As in Business Intelligence and Data Warehousing projects, a time exists for discovery of what is wanted and/or needed followed by a time for building what results from the requirements. In typical project management best practices, this discovery process is done through a phase called "requirements analysis”.
While requirements analysis tends to be a very broad topic, this insight will specifically focus on gathering the information requirements which are resulting in a conceptual information model. After all, the information model is the beating heart of any Business Intelligence solution. Its added value largely depends on the quality and the depth of the dimensions & the facts and their corresponding attributes & measures. On the other hand, it also goes without saying that the information model will dictate other key activities such as interface building, Extraction-Transformation-Loading (ETL), creation of a physical model and last but not least front-end BI modeling & reporting.
In terms of specifying information requirements, are the problems we are having today any different than what they were in yesteryear? Hardly. Let me take you back to an interesting report produced by the EDP ANALYZER in July 1977 (Vol. 15, No. 7) entitled, "Getting the Requirements Right." The report highlighted development failures based on poor requirements definition. An analysis was provided of the types of problems when specifying requirements:
% of Total Errors
- Incorrect Requirements 34%
- Missing/incomplete/inadequate 24%
- Unclear/ambiguous 22%
- Inconsistent/incompatible 9%
- New/change 3%
- Outside scope of project 4%
- Typographical errors 4%
Here are the questions:
- How many users will be accessing the reports and dashboards?
- How many users will be accessing the system concurrently?
- Who are the key and/or influential users?
- Their acceptance is very helpful in attaining overall acceptance?
- What types of users do you have?
- Static report users
- Analysts
- Developers
- Executives
- Who else should get this report?
- Who else should be aware that this report exists?
- How will they interact with the system?
- Interactive data exploration
- Static report consumption
- Will the user ask for this report again?
- Should we schedule it to automatically be sent?
- Should we make it a self-service report?
- What fields should we let the user customize?
- What fields should be limited in options?
- Where will the content be delivered?
- Web/Portal
- Mobile
- File System:
- Excel
- Word
- Response Time: Is there a minimum response time? - specifying the maximum elapsed time from start to finish. (Note: this is not a measure a machine throughput).
- What are the goals of the users in implementing BI?
- Why are those goals important to the business?
- What is their tolerance for error?
- Finance Groups: Zero tolerance for error.
- Others: 80% tolerance
- What is the group’s willingness to work with new dashboards/report?
- Are they excited or skeptical?
- Do they view it as a help or a threat?
- How long have they worked with the original Reports?
- What tools will be used?
- Is training required or are users already familiar with the tool(s)?
- What infrastructure is in place and what is required?
- Infrastructure:
- Do you have the servers and hardware necessary?
- Do you have the people and processes in place to support the solution?
- Who will be doing the development?
- In-house
- Outsourced?
- Do you have a dashboard/report Roadmap?
- Short-term
- Long-term needs
- Guideline for all BI related activities?
- Policy information: Supports executive actions/decisions
- Control Information: Implements policy and oversees operations
- Operational Information: Represents the daily routine affairs of the business.
- What are your business objectives?
- How would you interpret data set results?
- How should the data you work with be organized?
- Customer
Will this report filter by customer type? (B2B, Consumer, Retail, OEM, Distributor)
Does this report need to use the 80 / 20 rule? (Top 10, 50, 100)
Will this include customer returns? - Product
Will this report filter by product types? (Product Lines, Product Segments, Bulk)
Are we looking for a specific product? - Region
Will this be local only or International?
Will this have regional groupings?
Will this cover where the product was sold or shipped? - Time
What is the date range you are asking for? (Last month, last quarter, last 6 months)
Is this covering fiscal periods or calendar periods?
What level of detail do you want displayed? (Days, Weeks, Months, Quarters, Years) - Account
- Person
- Distribution
- Channel
- Offset - specifying the beginning of the cycle. For example, for a Monthly Sales Report, it will most likely begin on the last day of the month (as would payroll calculations).
- What are the hierarchies, rollups or aggregations used with these dimensions?
- Do customers roll up to geographies that roll up to total?
- Do products roll up to product groups?
- Do people roll up to districts that roll up to regions?
- What types of summary reports do you work with?
- What are the measures or facts you work with and how are they defined?
- Revenues
- Expenses
- Balances
- Variances
- Percent
- Measures
Will this report include currency?
Does it need to be in the local currency?
Will we be using the financial Gross or Net?
Will this report include Units?
Do we only need finished/complete units or should we include Work In Progress (WIP)?
Will this report include orders?
Will it include sample orders?
Will it include replacement orders?
Will this report include Visitors?
Will it include page views?
Will it include unique customers?
Will this report include Lifetime Value?
Will it include customer ranking?
Will it include customer status? New, Existing, Lost? - How do you “filter” the data?
- Do you need data only at the top and bottom accounts?
- Do you review the performance of only certain types of products?
- Do you segment the data based on demographics?
- Frequency: How often do you obtain refreshes of the data?
- Daily: 1D - Once a day
- Daily: 6D - Six times daily
- Weekly: 1W - Once a week
- Monthly: 1M - Once a month
- Quarterly: 1Q - Once a quarter
- Yearly: 1Y - Once a year
- Ad hoc: R - Upon Request ("any time I feel like it")
- Is the data clean?
- Do you receive the data in a timely fashion?
- Do the tools you use support your requirements?
- What types of things would you like to do that you can’t do today?
- What is your data availability?
- Do you spend most of your time on analysis or preparation for analysis?
- Exceptions: There is always some type of data to exclude. What should be excluded?
The initial requirements are identified through interviews, with a representative set of end users. In preparation for the interviews, it’s often useful for the end users to collect a sample of the reports they work with in reporting and analyzing their data as well as screen shots of any tools they use.
Once these question have been answered the specification should start looking as follow for each report:
NAME: (Name of the Report) A meaningful title for the report (e.g. Active Customers Name & Address)
NUMBER: (Report number)
DESCRIPTION: (Full description of the report) A concise description of the report that includes:
- The primary "thing" being reported on (e.g. customer)
The subject of the attributes being report (e.g. name and address)
The main criteria (e.g. status = active)
For example, "The Active Customers Name and Address report includes the names and addresses of all customers with a Status of "Active" and is grouped by State of residence."
BUSINESS PROCESS: Which business process is supported
The business process matrix which gives an overview of the combination of all relevant dimensions with all business processes within a certain subject area. A check mark in a cross-section points to a relevant relationship. Given the risk of duplicate data, more ETL development work, more upload time, different labelling and different terminology, it is important to use business processes here instead of departments.

BUSINESS OWNER: The person that will approve the creation of the report, and likely any future changes.
Is there a Service Level Agreement (SLA)? - This will dictate how much effort will be done to log report success/failure, does this warrant somebody getting a phone call at two in the morning to fix it, and how many resources should be thrown to break/fix it.
BENEFITS: (defining the tangible and/or intangible benefits of having this knowledge)
NOTE: This textual description validates the need for the information.
TIMING: Specifying Frequency, Offset, Response Time Schedule If the report is deployed to a "report server" should it have one or more standard schedules on which it runs?
TYPE INFORMATION: Policy, Control, Operational
TYPE INFORMATION: Policy, Control, Operational
INFORMATION DETAIL: Level of detail (grain)
Grouping If grouping, what are the group levels? How should each group be sorted? Should the group have subtotals and if so which columns and what is the calculation if complex (e.g. weighted average)? Should there be a page break and/or line before/between/after the group?
Sorting How should the report be sorted (which column(s), in what order, and which direction - ascending or descending)? Should the user be able to specify the sort order (dynamic sorting)? If grouping is present, what order should the groups be sorted? Is run-time sorting allowed on a column after report execution?
Sorting How should the report be sorted (which column(s), in what order, and which direction - ascending or descending)? Should the user be able to specify the sort order (dynamic sorting)? If grouping is present, what order should the groups be sorted? Is run-time sorting allowed on a column after report execution?
Parameters: User supplied values that will change the population. For each parameter
- Name as it would appear on the screen
- Format - Number, date, text, etc. Also is it free-form text, or populated from a range of values?
- Cascading - Are parameter 2 values dependent on what is selected in parameter 1?
- Should an ‘All’ option be added?
- Can users select multiple values?
- User security - Does any of the above require users to have access to only a specific set of parameters, such as the Seattle boss can only run it for Seattle?
- Filter Criteria What filter criteria (WHERE clause) are there if any? For example, should only "active" customers be included. Another example would be "completed" orders. Should these criterion be evaluated using an AND operator or an OR operator? The column(s) that the filter is applied to should be clearly stated. Label/text for the parameter, Drop-down, text, yes/no, Are multiple selections allowed? What are the values or where do they come from (static list of values or from a table) Should we assume that all criteria are applied to the result set or are the "OR" conditions? Does one parameter drive the value list of another parameter (e.g. Country changes values in state/region parameter drop-down)? What column or field in the result set should this parameter/filter be applied to?
LAYOUT: Column order, Landscape or portrait, Cross-tab or row/column, Headers and footers, Image/logo, Creation date, Page number and format (p. 1, page 1 of 10, etc.), Selected parameter value
Style sheet / cosmetics to use - most corporations have a corporate identity, this means that there should be a standard template to be used.
RECEIVERS: (representing the "consumers" of the information)
OUTPUTS: Since information is ultimately conveyed through some form of output, be it a screen, paper, audio, or other, now we can begin to determine what outputs (one or more) will be needed to satisfy the information requirement (be it a new or existing output).
Accessibility - How will it be accessed? Export format If the report is deployed to a "report server" what is the default format (Excel, Word, CSV, PDF) that it should be written to? If there are scheduled instances, what format should those be written to? Recipients (burst or data-driven - what is the logic?) If a scheduled report instance is burstable or a data-driven email subscription (SSRS) who are the recipients? Is it a static list or is it data-driven? Charts or graphs? Drill-downs? Links to other reports (drill-through)?
Availability - Once a day at 8 am, 24/7, etc.
POPULATION: “All x's by y for time period z-1 to z-2”. Also note if report values are supposed to match any other report.
DATA REQUIREMENTS: Specifying all of the primary and generated data elements required to support each information requirement. Pay particular attention to generated values, as they have to be traced back to all of the primary values needed to compute the generated items (even if they will not ultimately appear on an output). The information matrix gives an overview of the combination of all relevant dimensions with all facts within one single business process. The cross-sections indicate the granularity or level of detail. A check mark in a cross-section points to a relevant relationship. In the below the atabase table and column name if possible must be included with
DATA REQUIREMENTS: Specifying all of the primary and generated data elements required to support each information requirement. Pay particular attention to generated values, as they have to be traced back to all of the primary values needed to compute the generated items (even if they will not ultimately appear on an output). The information matrix gives an overview of the combination of all relevant dimensions with all facts within one single business process. The cross-sections indicate the granularity or level of detail. A check mark in a cross-section points to a relevant relationship. In the below the atabase table and column name if possible must be included with
- Label text for the report
- Any calculation
- If it's a link to another report or external source and if so a description of how the link should work
- If it's a sort able column
- Right, left, or middle alignment
- Value formatting (MM-DD-YYYY, YYYY-MM-DD, $100, ($100.00), etc.)
Typically this matrix will be detailed more towards its final conception.
- When the dimension levels will be detailed further, a check mark might be replaced by a certain dimension level which might be more applicable than the most atomic detail of that particular dimension in relation to a certain fact, or will remain a check mark indicating the lowest level as defined within the dimension.
- This matrix (likewise for the business process matrix) can also be used by replacing the check marks by priorities, availability, source complexity or cost and as such revealing other interesting viewpoints.


IMPORTANCE OF REPORT:
M = must have this
S = should have this if at all possible
C = could have this if it does not affect any other requirement of being delivered
W = won't have this time, but would like to have in the future
If you are interested in buying my template: Business Intelligence Requirements Template See Template
INFORMATION DRIVEN DESIGN
After the Information Requirements have been defined in this manner, it becomes a relatively simple manner of designing the system and supporting software. The data and timing requirements of the IR Definition will ultimately dictate how data is collected, stored, and retrieved (processing).
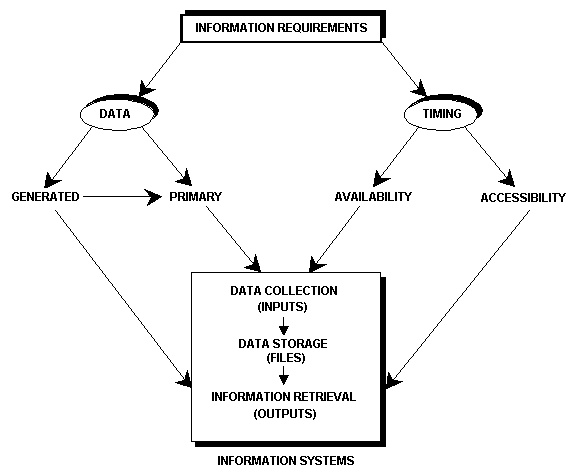
Under "Information Driven Design" the emphasis is to work backwards to define the necessary business processes (sub-systems), complete with inputs, logical files and outputs. Following this, each business process is detailed in terms of its procedural work flow, from start to finish (forward design). By the time we get to software engineering, the programs should be fully specified in terms of data and processing requirements.
- Increased Productivity
- Improved Solution Quality
- Rapid Results
- Longer Lasting Results
- Enhanced Teamwork and Cooperation
- Lower Development Costs
SUMMARY:
The success of any Data Warehouse & Business Intelligence solution is determined at the beginning of the project life-cycle when analysts face the business to gather their requirements. Poor gathering of business requirements is one of today's main Data Warehouse & Business Intelligence project failures. One of the key aspects within all those business requirements is the information model. It requires a good preparation and experienced facilitators & analysts with the right skill set to discover the true business needs in this area. But above all, it requires a specific approach for gathering the needed requirements.
Let's review the basic attributes of information:
Let's review the basic attributes of information:
- Information represents the intelligence or knowledge needed to support the actions and/or decisions of the business; it is not synonymous with data.
- Information is a "consumable" commodity used by human beings.
- Information is a "perishable" commodity; it only has value to the end-user at a specific moment in time.
- Information Requirements dictate data and processing specifications.
- If the information requirement is incorrect, that everything that follows will be incorrect.